| Table of Contents |
|---|
...
...
You can also find usefull and step-to-step guide on how to develop and run custom rules in the following posts of Kiuwan Blog
- Rules development (I): Where do we start?
- Rules development (II): basis for implementation
- Rules development (III): debugging custom rules
- Rules development (IV): Basic API – navigating through the AST
- Rules development (V): Query API
Prerequisites
...
...
...
The same prerequisites that apply to Kiuwan Local Analyzer apply to Kiuwan Rule Developer, please check them out before continuing to the next section.
All in all, you will need two tools for rule development:
- Kiuwan Rule Developer. This is included with the latest Kiuwan Local Analyzer.
- A code editor you feel comfortable with. This can be your favourite IDE, like Eclipse, iDEA or a text editor like Vi or Emacs.
...
...
...
...
...
...
...
...
...
...
...
...
...
...
...
...
...
...
...
...
...
...
...
...
...
...
...
...
...
...
...
...
...
...
...
...
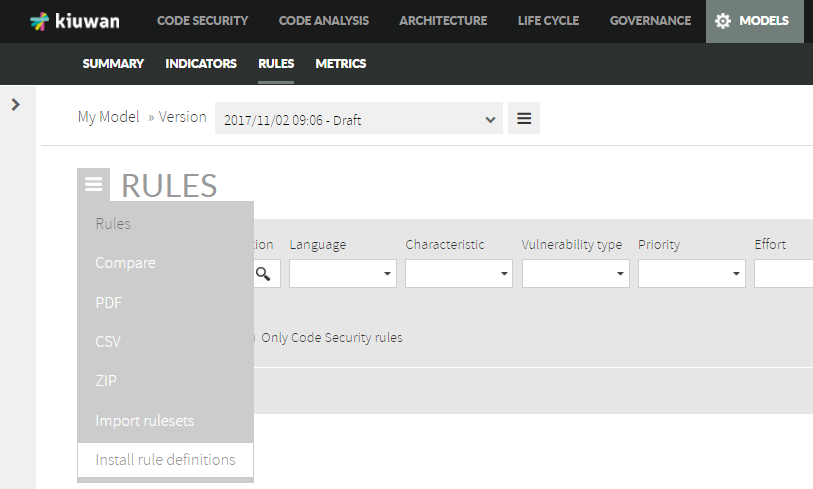
| Step | Screenshot |
|---|---|
| 1. | 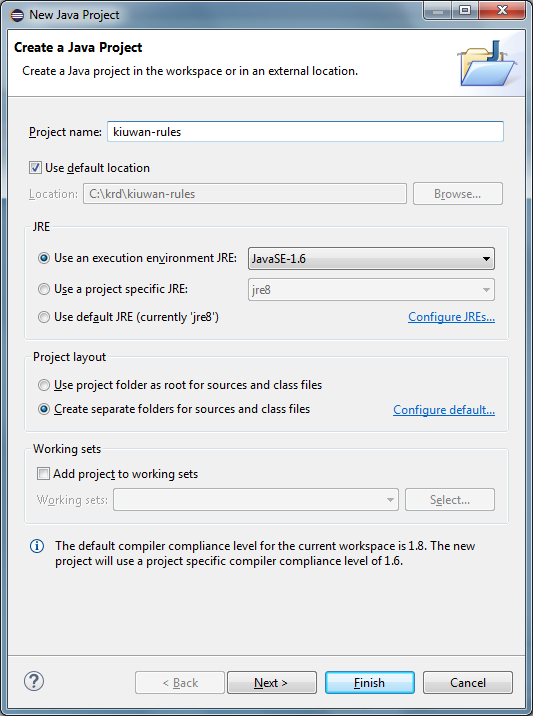 |
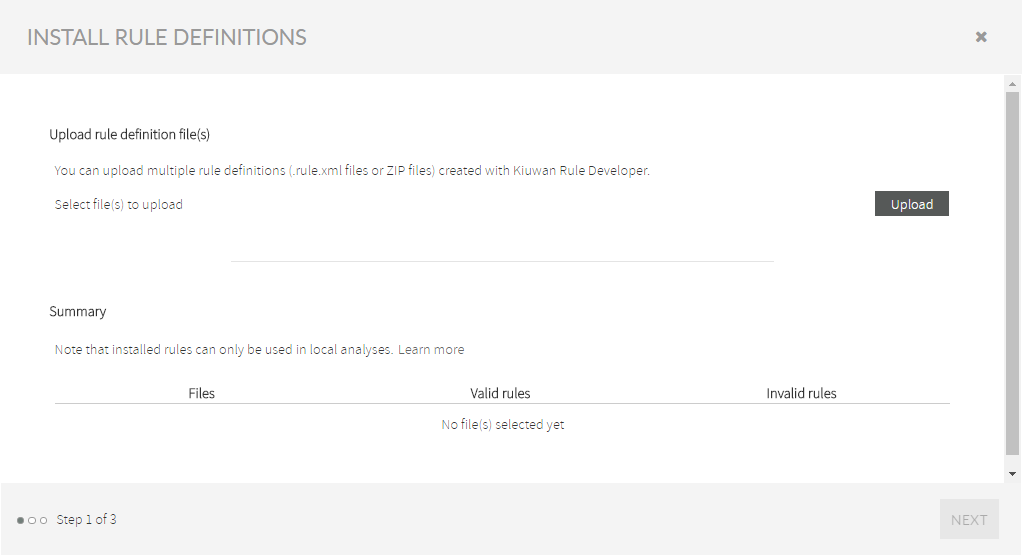
| 2. | 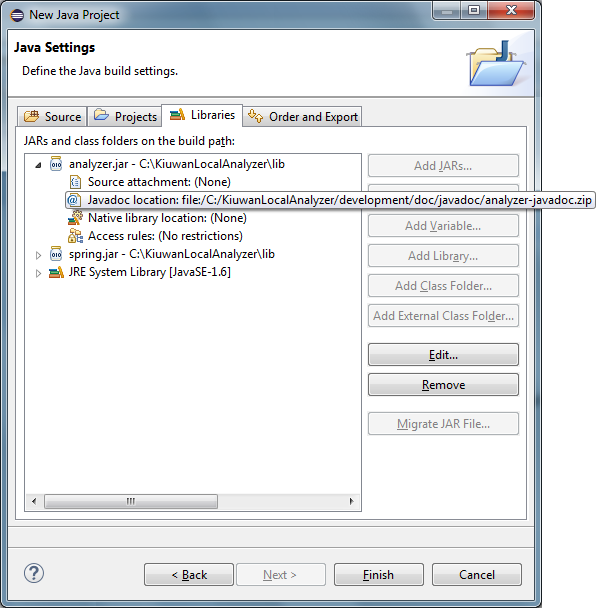 |
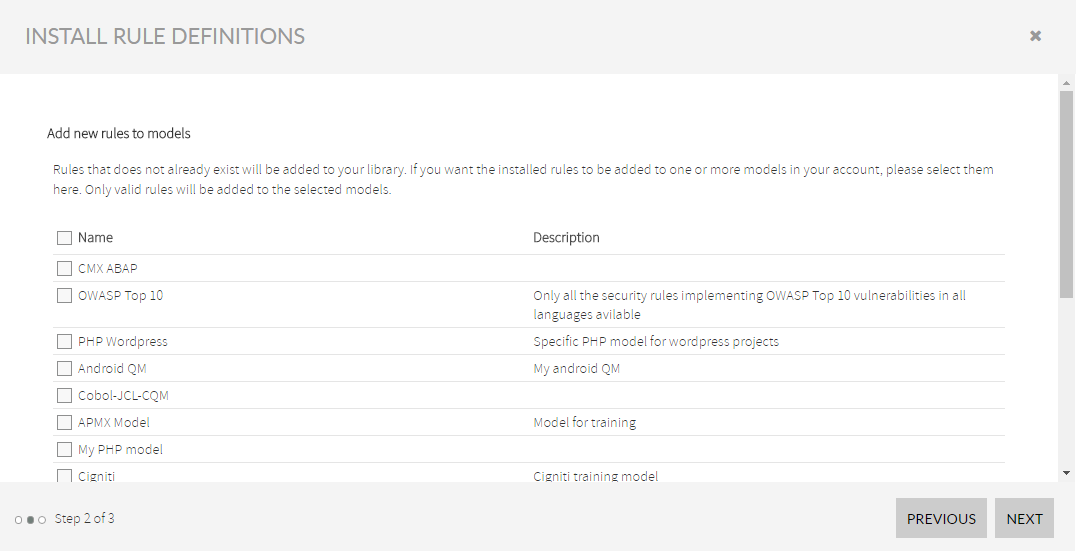
| 3. | 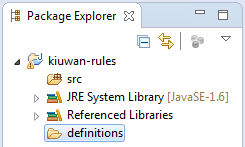 |
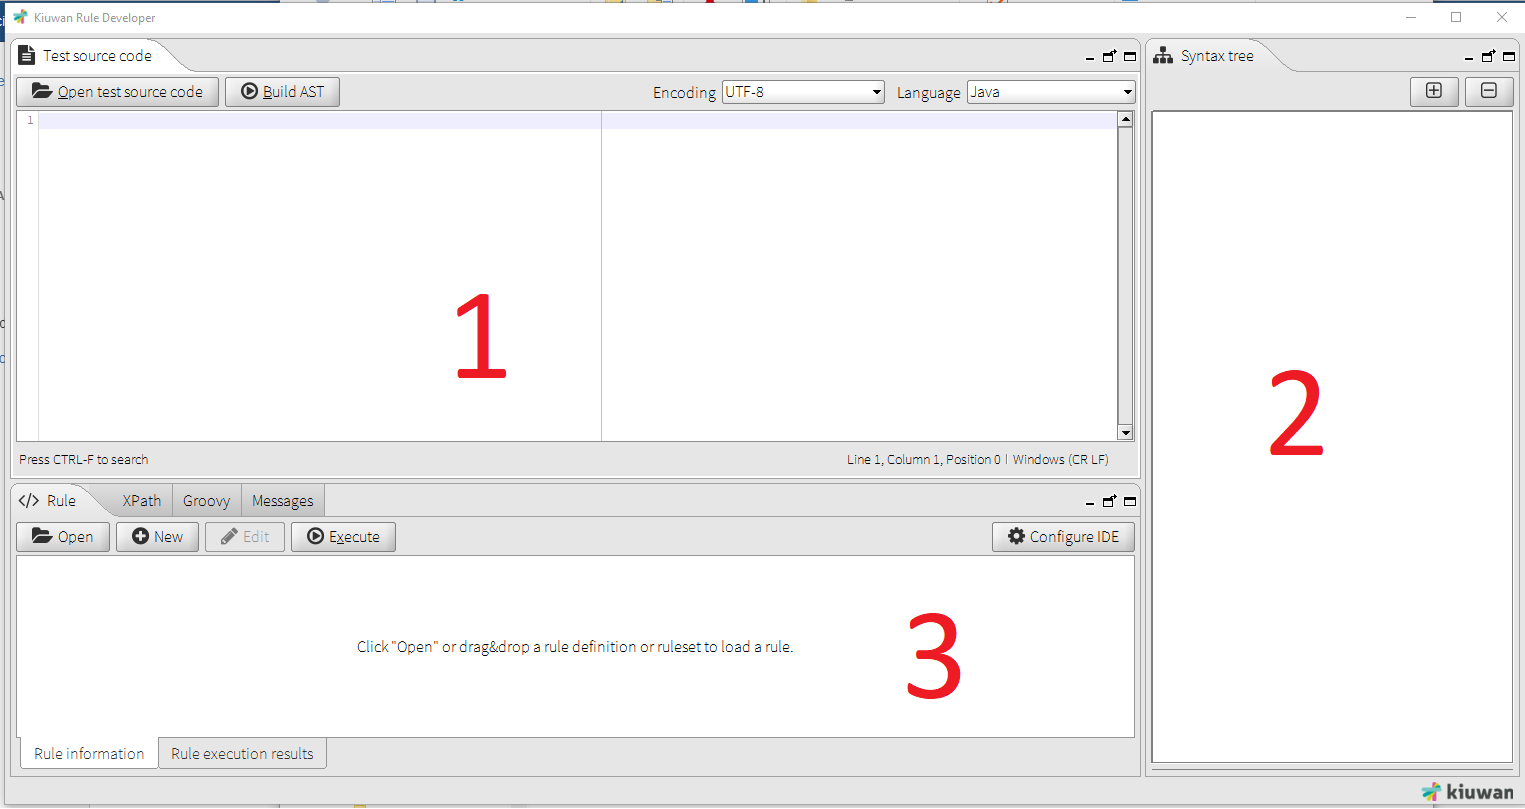
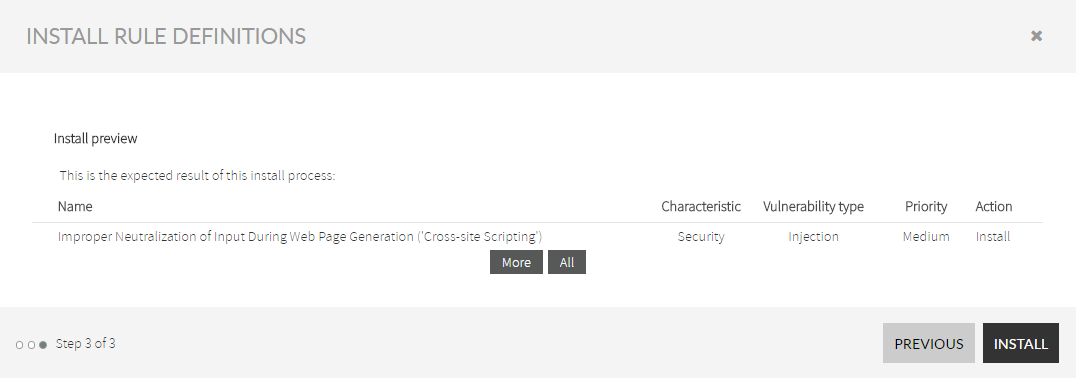
This is all
...
...
...
...
...

...
...
...
...
...
...
...
...
...
...
...
...
...
...
...
...
...
...
...
...
...
...
|
| 2b. |
...
 |
| 3. |
...
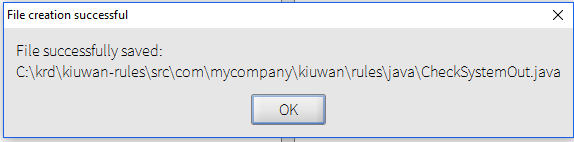 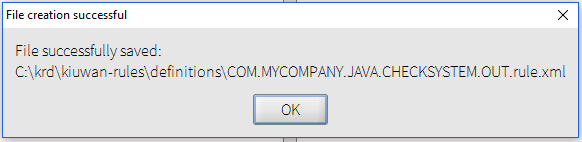 |
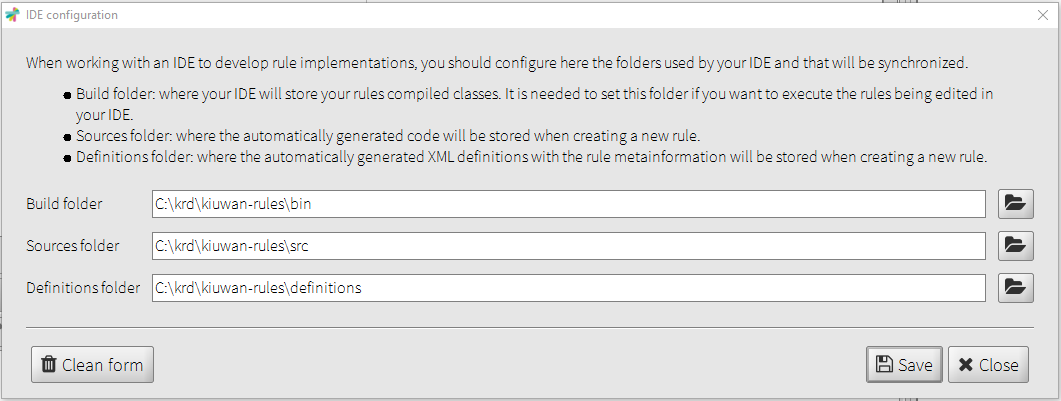
After saving the rule, two files will be created:
- The base source code of the rule, located in the previously configured build folder.
- The rule definition file, located in the previously configured definitions folder.
Once the new rule
...
...
Edit the rule template
Back to Eclipse, you should refresh to project contents to see the files created by Kiuwan Rule Developer.
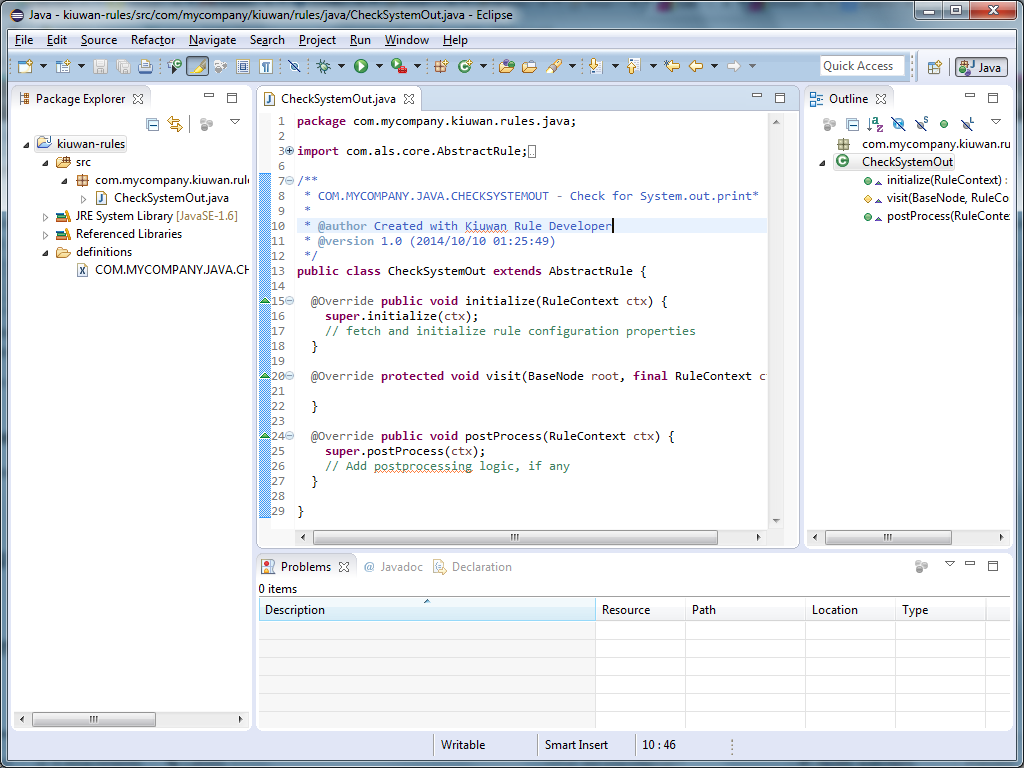
In our example, Kiuwan Rule Developer has created the following files:
- The rule base code: src/com/mycompany/
...
...
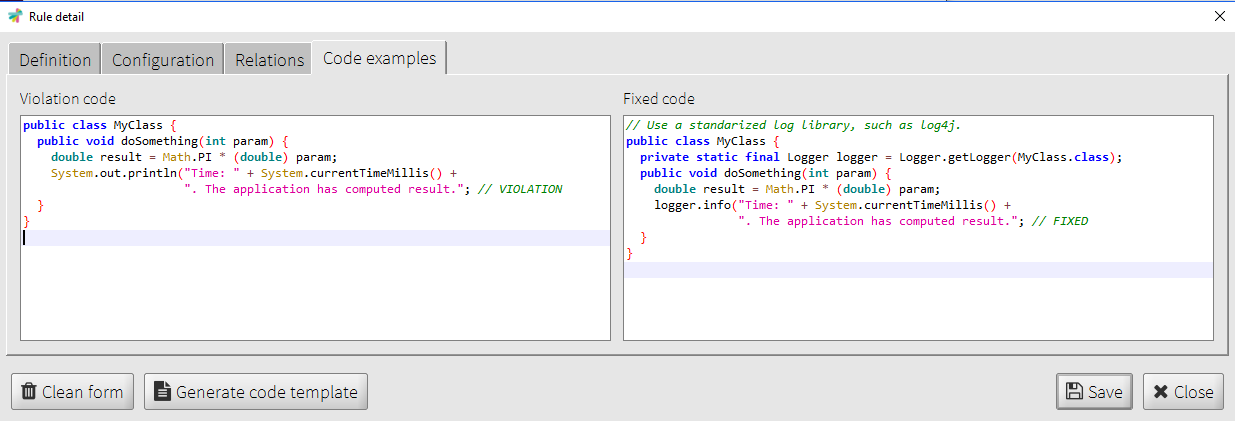
Rule Development guide.
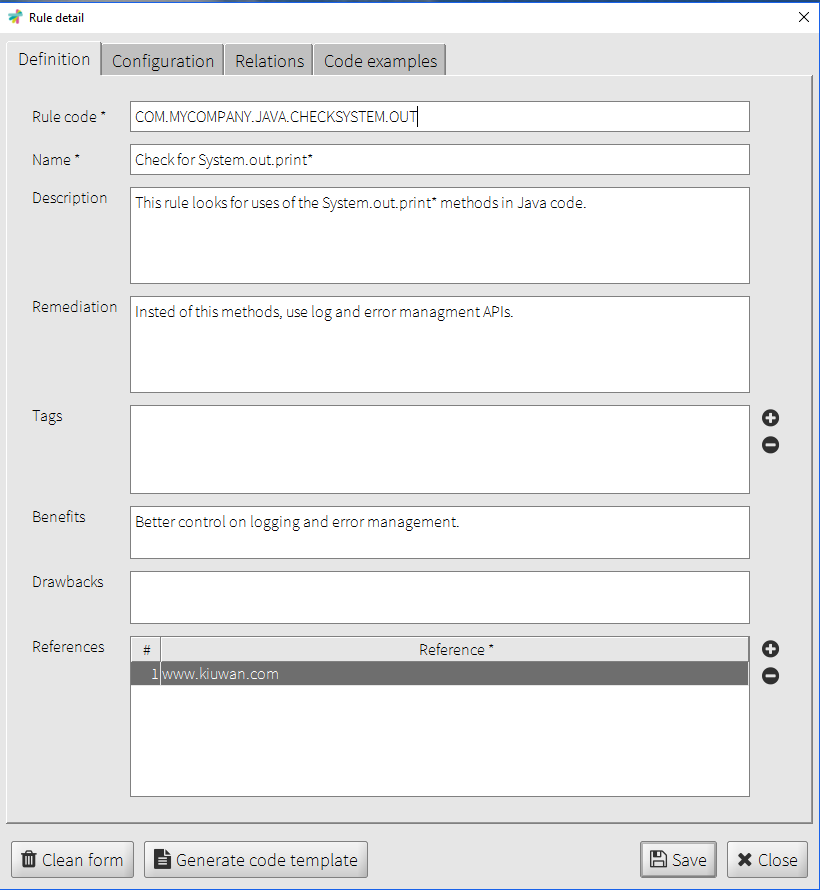
In our example, we want to detect the uses of System.out.print(String) and System.out.println(String) in Java code. So this will be the source code for our rule:
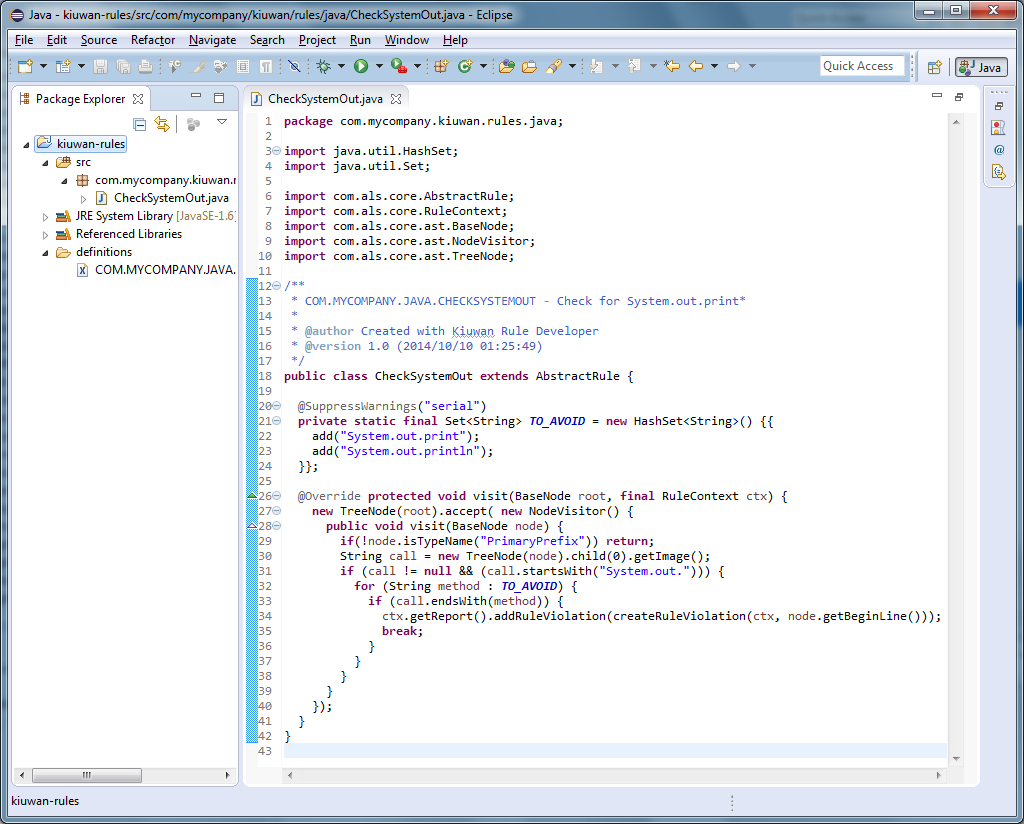
Eclipse compiles the rules as we save changes in the file (you should have the
...
...
...
...
...
...
...
...
- Click Execute to see the results of applying the rule to the test code.
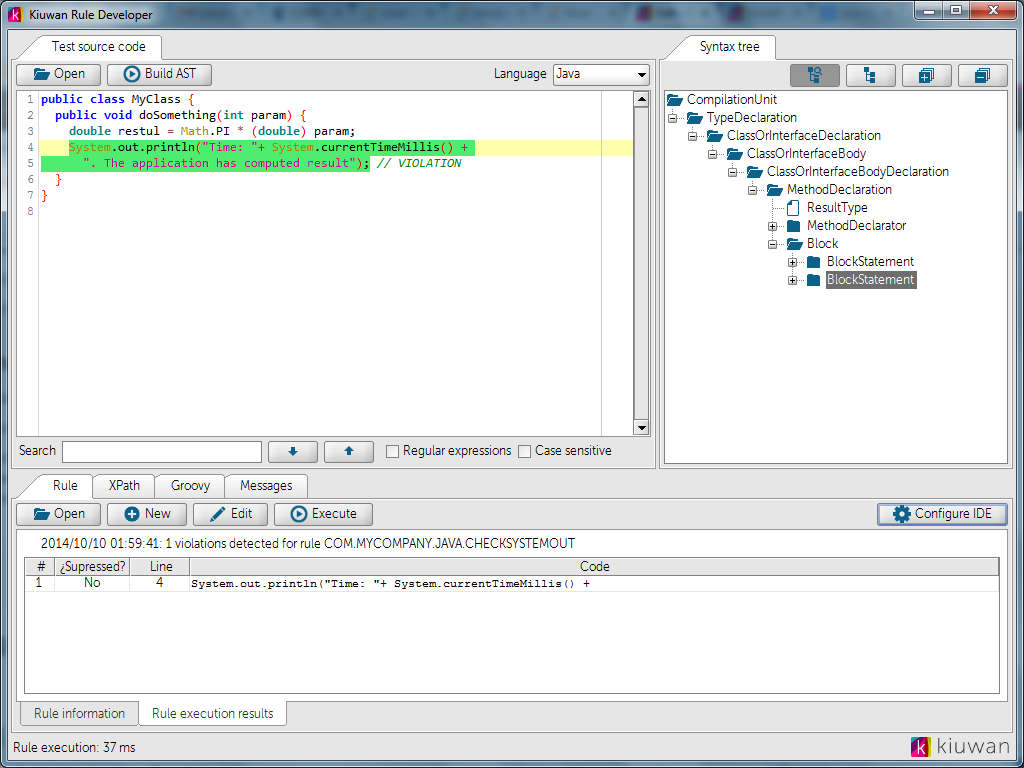
As you can see in the previous screenshot, the "Rule execution results" tab will be automatically selected with the results of applying the rule to the test source code. In our example, one violation will be detected in line 4. This line uses one of the methods the rule looks for.
You can modify the rule in your IDE and execute it in Kiuwan Rule Editor as many times as you need until you are satisfied with your rule's implementation. Kiuwan Rule Editor automatically detects changes in the compiled code, as long as you have correctly configured your IDE as we did in the previous sections.
...
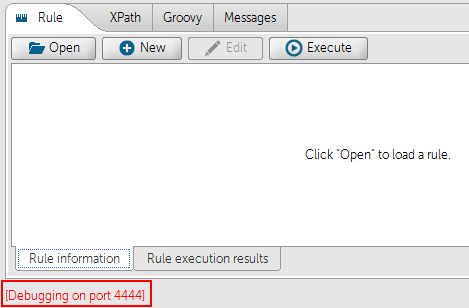
Kiuwan Rule Developer allows you to remotely debug the rule you are editing in your IDE while it is being executed.
If you want to debug your rules, you should launch Kiuwan Rule Developer in debug mode. To do so, open a console and type:
Windows:
> AGENT_HOME/bin/agent --development debugPort=4444Unix:
> AGENT_HOME/bin/agent.sh --development debugPort=4444This will launch Kiuwan Rule Developer and wait for a remote debug tool to be attached on the specified port (in the previous examples, port is 4444).
Note that the application will not be launched until the remote debug tool is detected by the process. Make sure the specified debug port matches the one configured in your remote debug tool. If the attachment is successful, you will see a red label indicating the current debugging port in the bottom left of the Rule Developer window:
...
...
...
...
...
...
...
...
...
|
| 4. |
...
|
| 4.a. |
...
|
| 4.b. |
...
|
| 4.c. |
...
|
| 5. |
...
 |
...
...
...
...
...
...
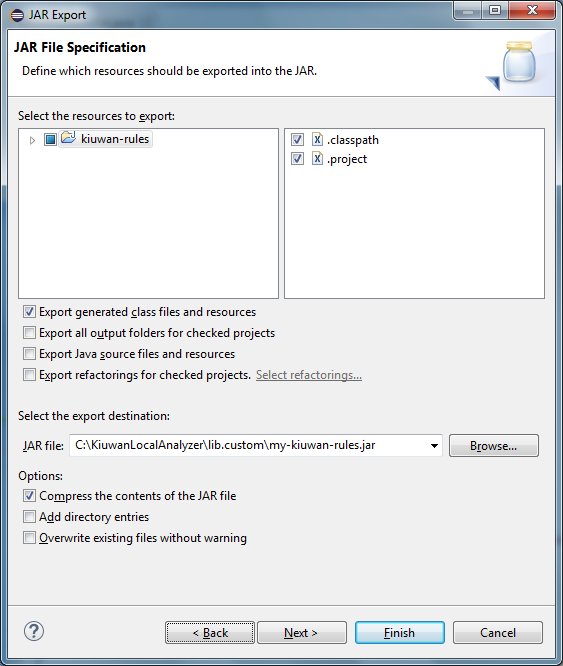
- to export your rules project.
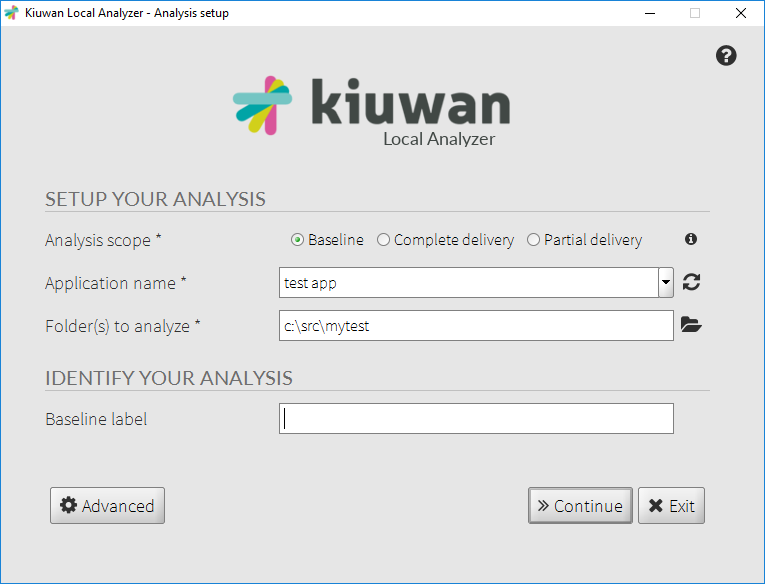
Now everything should be prepared to launch your analysis.
The next step is to run Kiuwan Local Analyzer and analyze your application. If you need more information on this topic, please read the Kiuwan Local Analyzer page.
We will use a test application made of two Java classes. One with a rule violation, one with no violations. We will call this application
...
...
...
...
...
...
...
...
...
...
...
...
...
...
...
...
...
...
 |
...
...
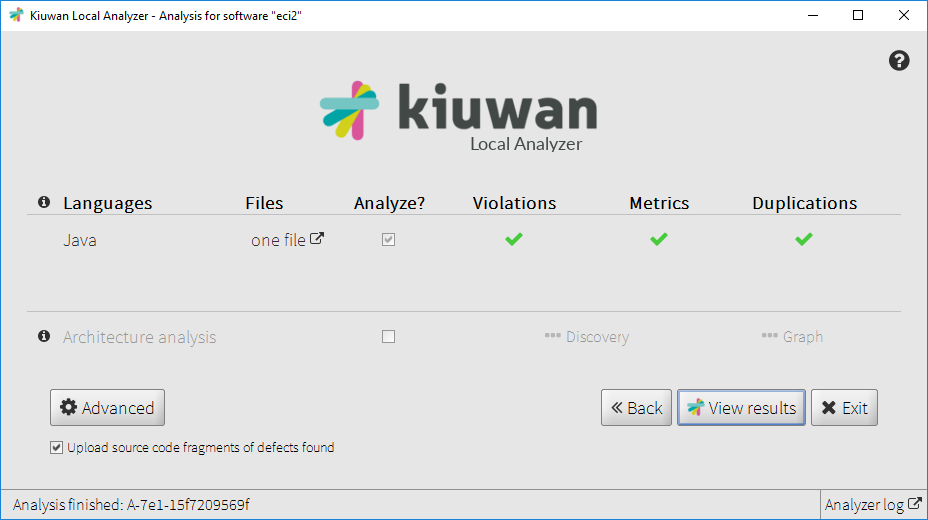 |
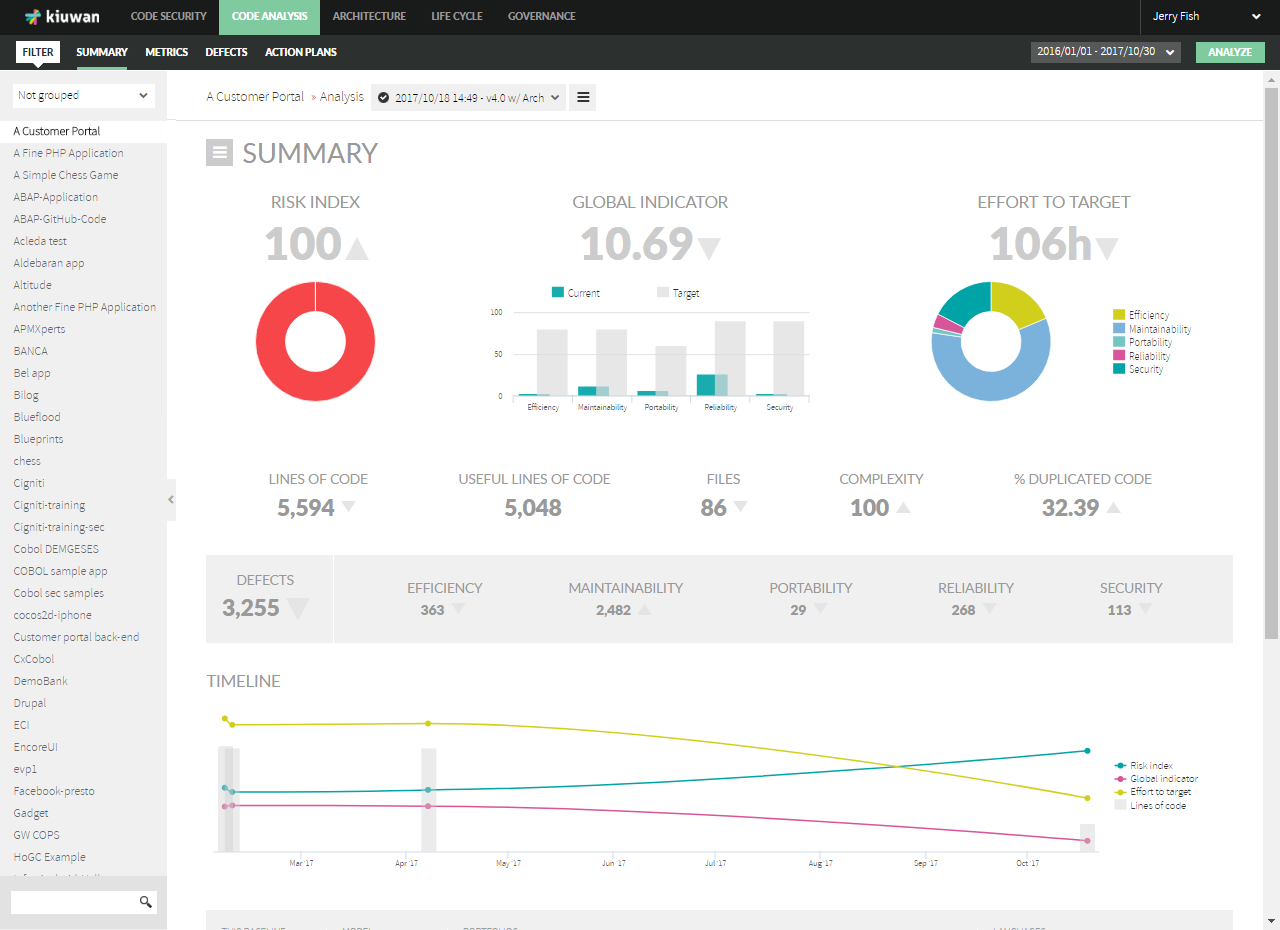
Step 5: View the Analysis Results
...
...
...
...
In our example, one violation has been detected in one file, as we can see in the analysis overview:

...
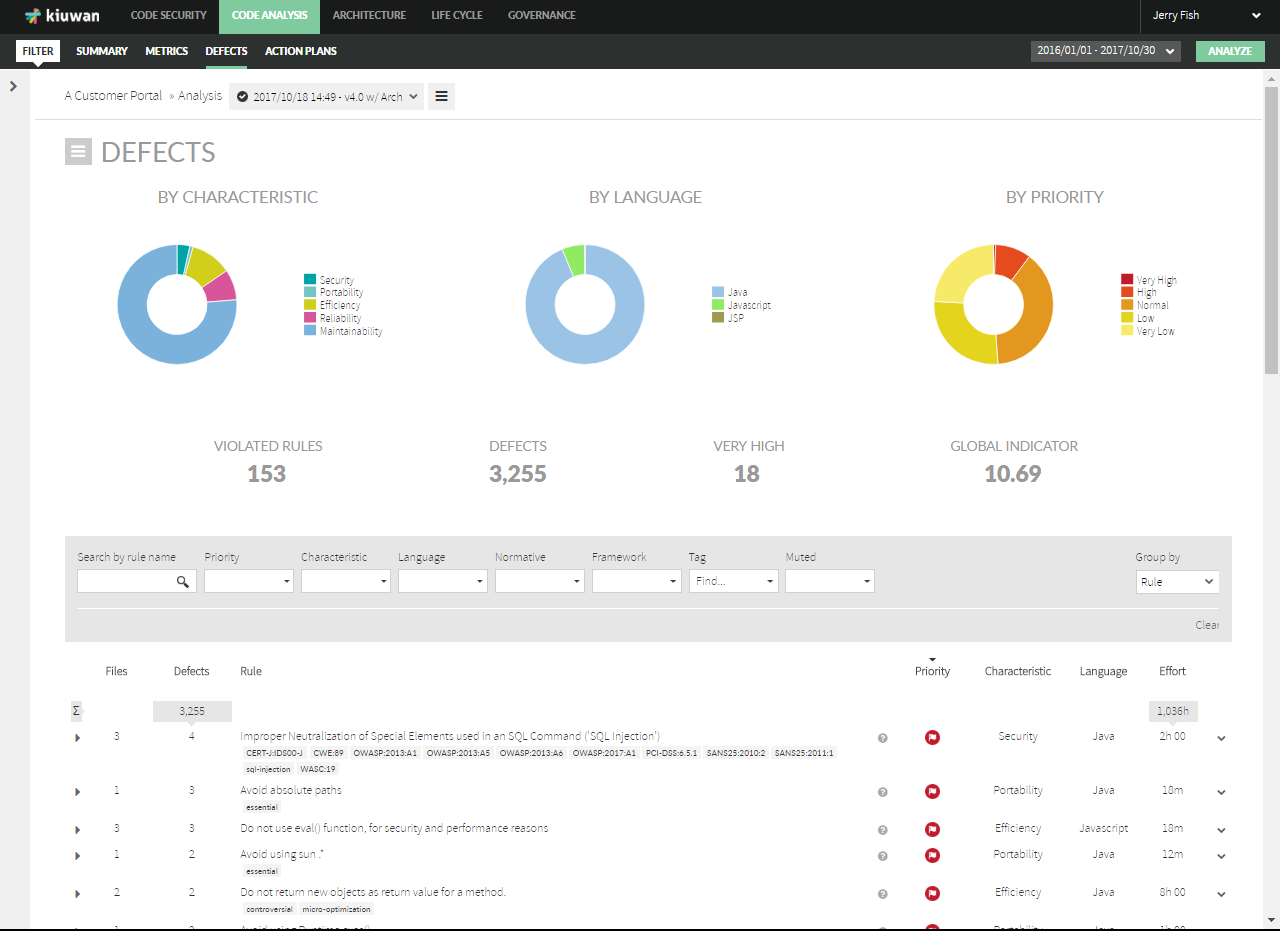
Access the Defects section to see a defect emitted by
...
...
...
...
Summary
In this quick start guide, we have seen how to create, modify, pack, install and execute a custom rule for Kiuwan. We can summarize the needed steps in the following list:
- IDE: create a project and configure it to be used with Kiuwan Rule Editor.
- Kiuwan Rule Developer: wire with your IDE.
- Kiuwan Rule Developer: create a custom Kiuwan rule.
- IDE: implement your custom rule from the automatically created template.
- Kiuwan Rule Developer: execute and check the results of your custom rule.
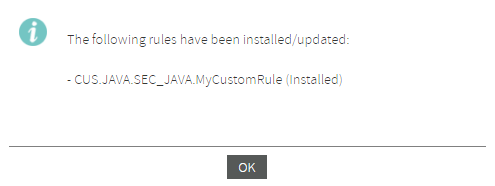
- Kiuwan: install your custom rule and use it in a quality model.
- IDE: pack your custom rule code and deploy it to Kiuwan Local Analyzer.
- Kiuwan Local Analyzer: execute an analysis of your application.
- Kiuwan: view the results of analyzing your application with your custom rule.
...
...
...
...