
Connect Kiuwan with your Travis CI workflow, this new integration is designed to empower teams to seamlessly add security to any development project. This relatively simple Typesrcipt project can seriously simplify the way teams use Kiuwan within their development process.
In this article, Montana Mendy from the Travis CI team walks us through the process of integrating Kiuwan into your Travis CI approach.
This is an integration between Travis and Kiuwan, there’s a lot of moving objects to this – some declarative. What I’ve done is try to make the .travis.yml as simple as possible as this is the first time I personally know this has been done.
In Travis, I told Travis to fetch the Local Analyzer, then went through Kiuwan’s LA’s documentation to make a command that checks the project. This project in particular is in TypeScript, below I’ll share the .travis.yml file I’ve created:
language: java install: skip script: – echo $TRAVIS_BUILD_DIR – export APPNAME=$(basename $TRAVIS_BUILD_DIR) – export BRANCH=$(if [ “$TRAVIS_PULL_REQUEST” == “false” ]; then echo $TRAVIS_BRANCH; else echo $TRAVIS_PULL_REQUEST_BRANCH; fi) – echo “Fetching Kiuwan Local Analyzer” – wget -v https://www.kiuwan.com/pub/analyzer/KiuwanLocalAnalyzer.zip – unzip KiuwanLocalAnalyzer.zip -d $HOME/. – $HOME/KiuwanLocalAnalyzer/bin/agent.sh –user $kiuwan_user –pass $kiuwan_password -s $TRAVIS_BUILD_DIR -n $APPNAME -l $TRAVIS_BUILD_ID -c
This then sends this to Kiuwan, and from there I can access more insights about my project. In this project in particular I made this have a few vulnerabilities so Kiuwan would catch them. I also used environment variables from my account I registered from the Jelly service.
Michal Rybinski and I earlier in this day had a conversation about theoretical ways in this could work, where all attempts (at least on GitHub) have failed, so what I did was make a pretty standard .travis.ymlchmod u+x kiuwan.sh
We are changing the permission using chmod then running kiuwan.sh which takes all the steps I set the .travis.yml to do, and put that under the Travis script hook.
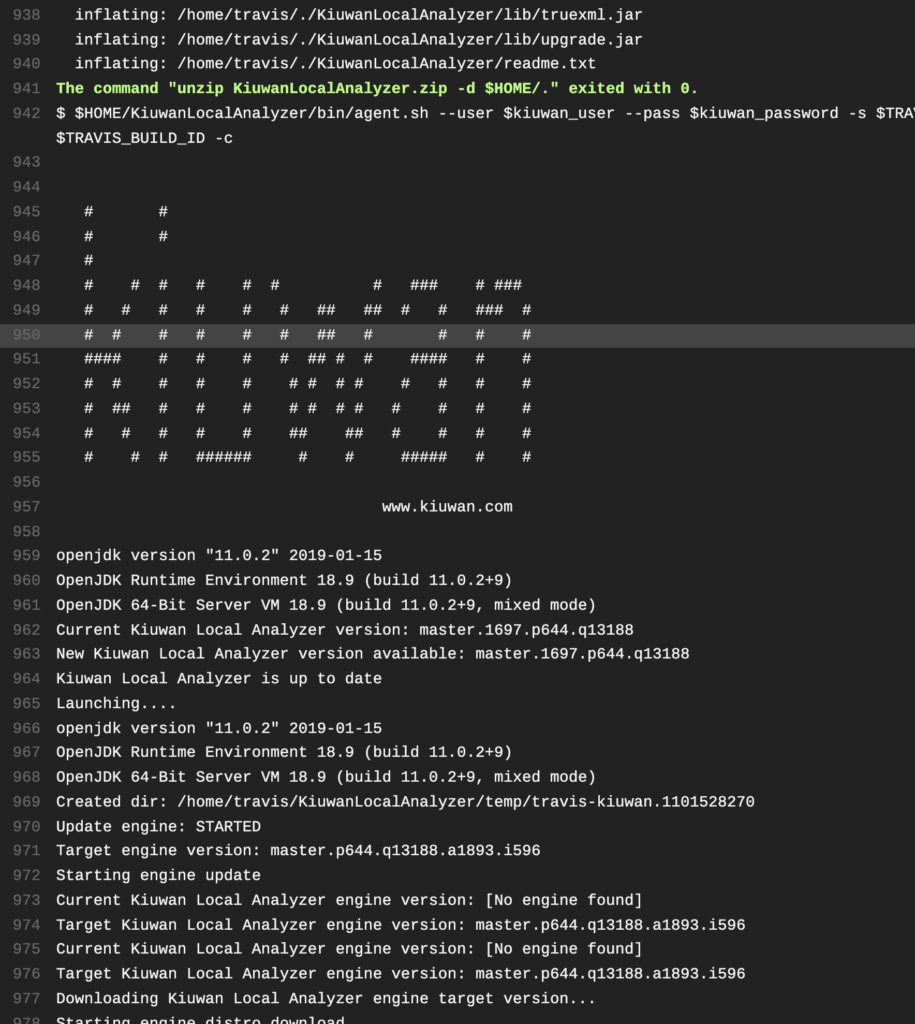
This is the first time this has been done on GitHub to my knowledge, there was some questions on the conditionals when running the agent.sh. A successful call to Jelly should look like this in the Travis build log:

You’ll then notice output of the Local Analyzer working:
Discovery: STARTED
Technologies discovered: html,javascript
Technologies that will be analyzed: html,javascript
Discovery: FINISHED
Preprocess: STARTED
Preprocess: FINISHED
Model retrieval: STARTED
Model downloaded from Kiuwan
Model retrieval: FINISHED
License check: STARTED
License check: FINISHED
Prepare analysis data: STARTED
Supported technologies in current model: html,javascript
Prepare analysis data: FINISHED
Prepare source code files for upload: STARTED
Prepare source code files for upload: FINISHED
Remember you can select VM size as well – this will affect (in my case) how deep the scan will go, in this particular use case though I just used baseline. Kiuwan will calculate the heap size, and collect the bill of materials (TypeScript, other dependencies):
bill-of-materials:
bill-of-materials format:
includes:
excludes: **/src/test/**,**/__MACOSX/**,**/*.min.js,**/*.Designer.vb,**/*.designer.vb,**/*Reference.vb,**/*Service.vb,**/*Silverlight.vb,**/*.Designer.cs,**/*.designer.cs,**/*Reference.cs,**/*Service.cs,**/*Silverlight.cs,**/.*,**/Pods/BuildHeaders/**/*.h,**/Pods/Headers/**/*.h,**/node_modules/**,**/bower_components/**,**/target/**,**/bin/**,**/obj/**,**/dist/**,**/lib/**
configuration:
VM version: 11.0.2
VM settings:
    Stack Size: 2.00M
    Min. Heap Size: 128.00M
    Max. Heap Size: 1.00G
    Using VM: OpenJDK 64-Bit Server VM
As you can see my min heap size is 120MB, and my max is 1000MB (or a gigabyte). It also gives me some cursory information about the VM. I’m wondering if there’s a way to get more verbose information about that particular VM?
As you can see my min heap size is 120MB, and my max is 1000MB (or a gigabyte). It also gives me some cursory information about the VM. I’m wondering if there’s a way to get more verbose information about that particular VM?


