The Open Web Application Security Project (OWASP) is best known for maintaining a list of the Top 10 security vulnerabilities in web and mobile applications. However, these aren’t the only projects the independent, non-profit organization oversees. The OWASP Benchmark is an incredibly useful tool that can help you develop more secure applications.
This free software suite evaluates the speed and accuracy of automated software vulnerability detection tools. It provides an unbiased method of measuring the results of static application software testing tools. The OWASP Benchmark tests thousands of exploitable vulnerabilities to provide a standardized measure of any application vulnerability tool. Each test case is mapped to the appropriate Common Weakness Enumeration (CWE) number for that vulnerability.
As a static application security testing (SAST) provider — and OWASP contributor member — we fully support the mission of OWASP and wanted to measure how our Code Security product performed on the OWASP Benchmark. You can use the results to compare Kiuwan with other tools you’re considering to make an informed decision.
We originally conducted this test in 2017 and reran this in August 2025, but the OWASP Benchmark’s importance and relevance are more vital in today’s complicated threat landscape. Current cybersecurity threats are powered by artificial intelligence (AI) applications that allow attacks at an unprecedented scale. Kiuwan’s ease of use ensures that analyzing comprehensive test cases like those in the OWASP Benchmark remains seamless even today. The results provide actionable insights for secure development.
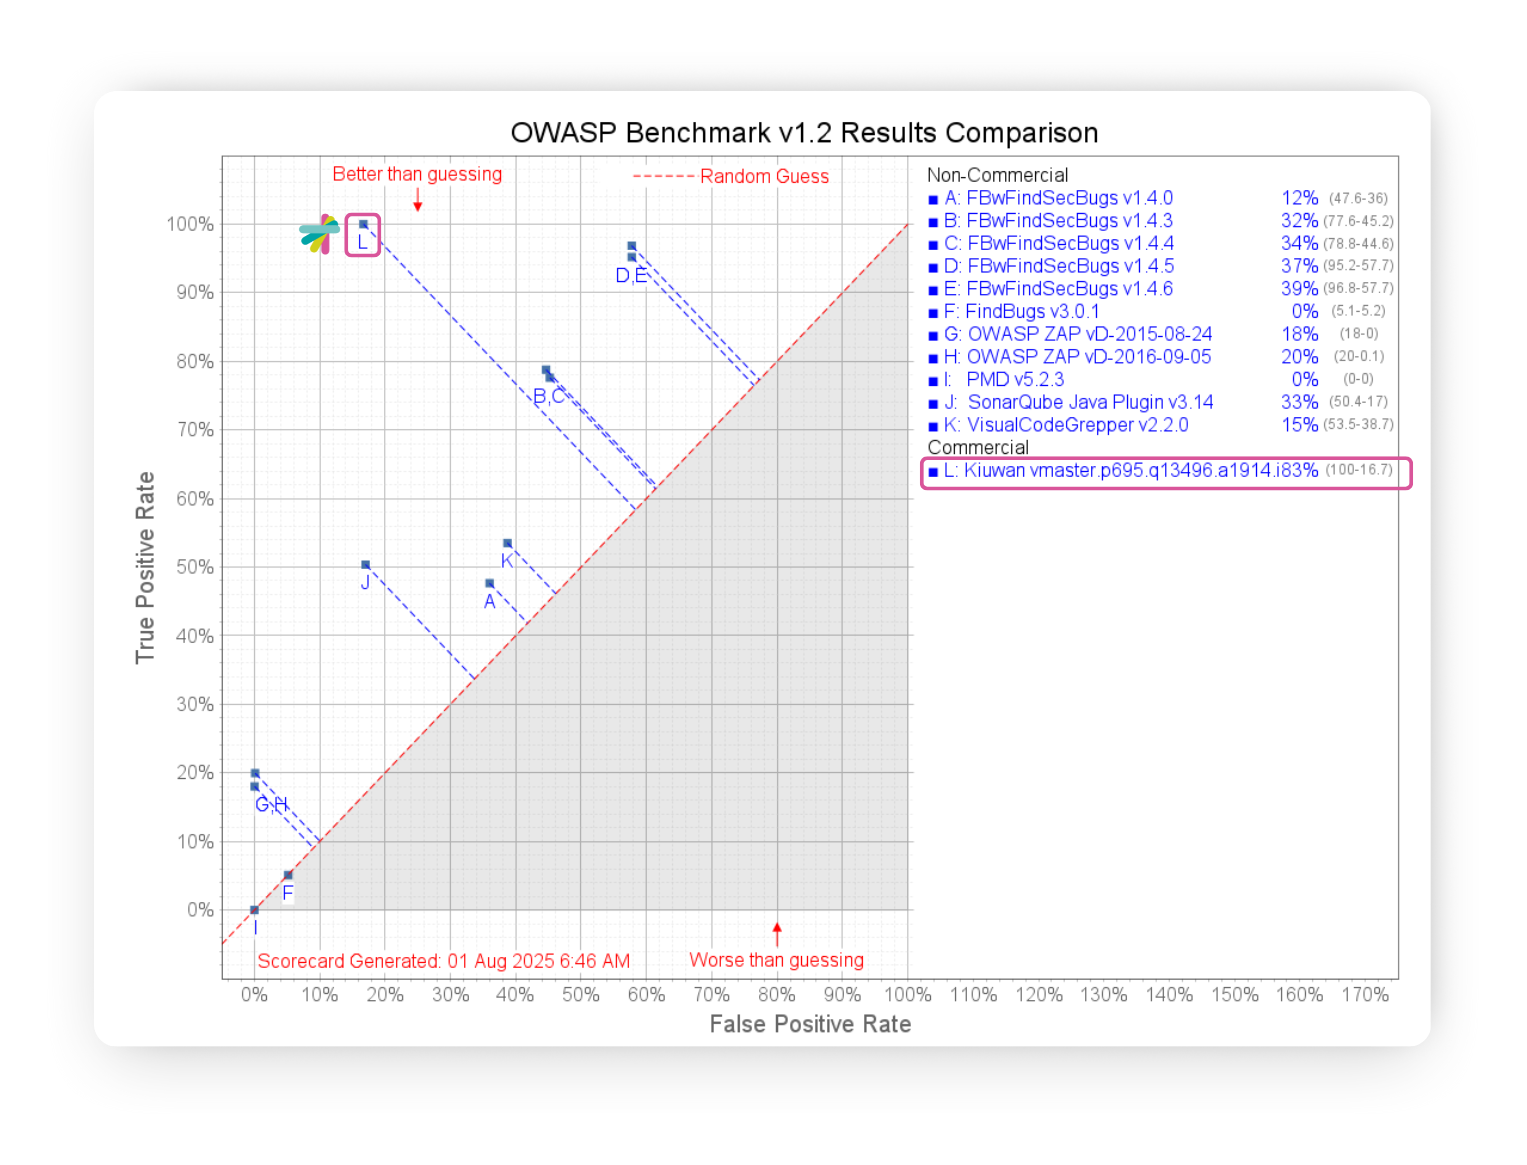
The following scorecard demonstrates Kiuwan’s initial results in the OWASP Benchmark test:
Here are the detailed results that align with the points in the graph:
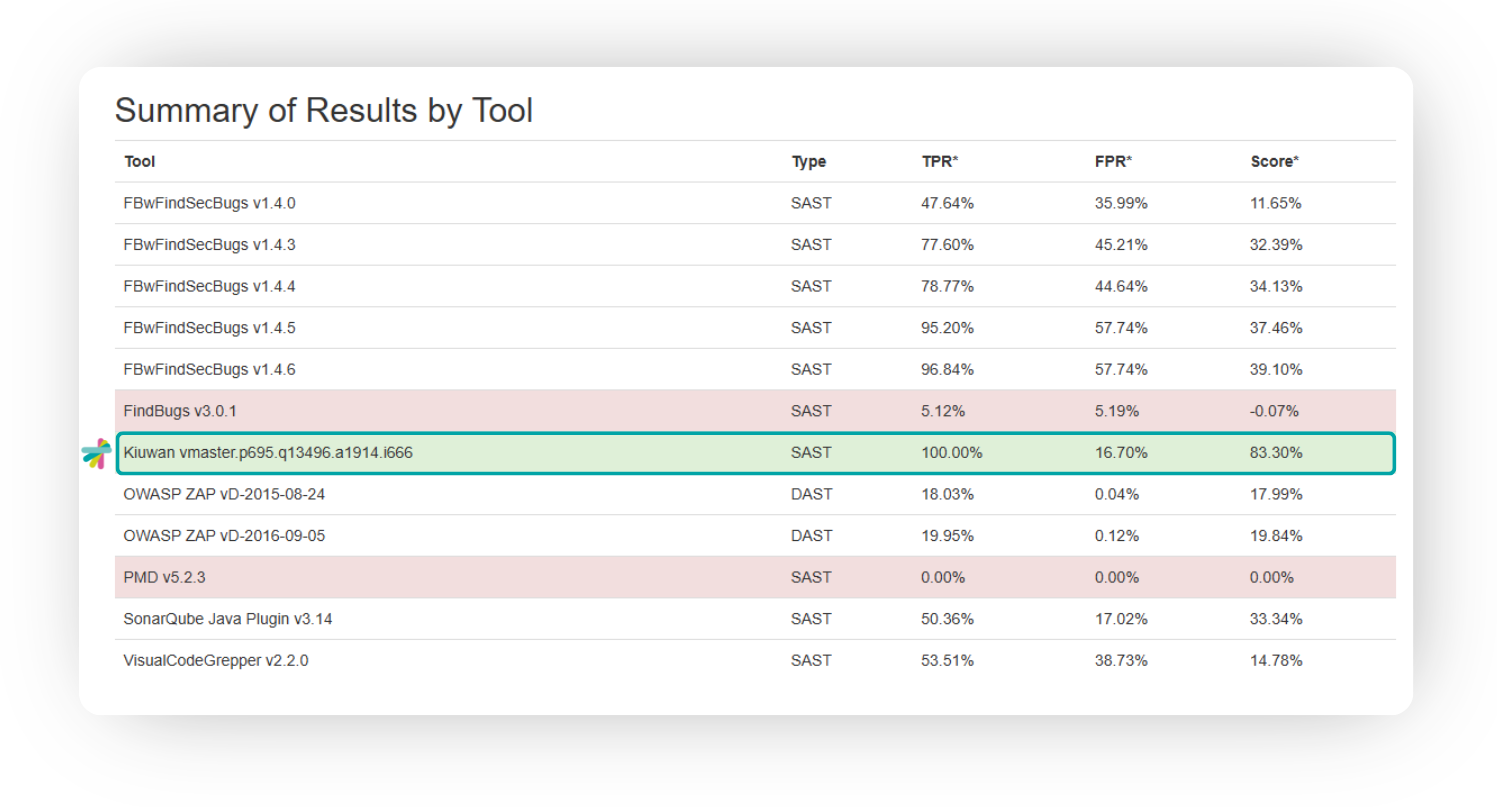
Kiuwan’s results were impressive, with a 100% True Positive Rate (TPR), indicating it reports on almost all vulnerabilities in the benchmark code. With modern applications having so many potential attack vectors, you need automated tools to identify them. While many tools with high TPRs have correspondingly high False Positive Rates (FPR), Kiuwan’s SAST only experienced a 16% (FPR). So, it won’t slow development by sending your team chasing nonexistent threats.
Ideally, you want a sensitive and specific tool, which is Kiuwan’s target. The following graph compares the results of 17 tools (16 SAST and 1 DAST) on the benchmark site. We’ve anonymized the other tools to focus solely on performance.
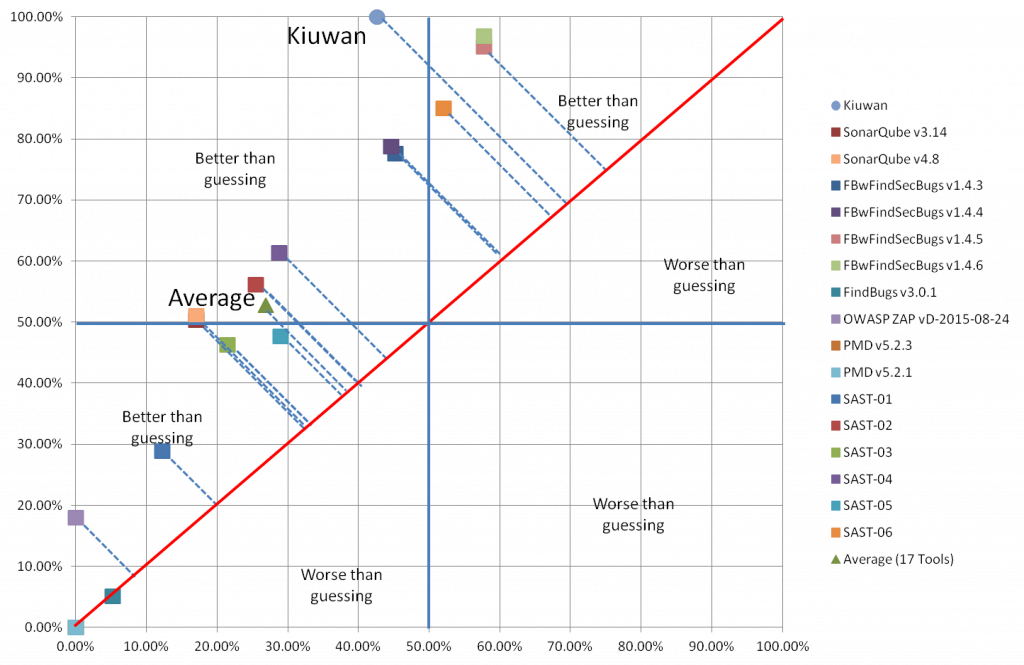
Three of the tools were not designed for security testing, which is reflected in the fact that they’ve performed below the results you’d get from guessing. The others all outperformed guessing. The farther above the guessing line, the better the results.
Youden’s index combines sensitivity and specificity and is a measure you can use to judge both. There’s always a trade-off between the two; Youden’s index can help you make an informed analysis.
In today’s challenging regulatory landscape — with steep financial, legal, and reputational penalties for data breaches that stem from noncompliance, you want a tool that reports as many real threats as possible. While false positives can be annoying, it’s generally better to have a little “noise” in your results than to overlook a real threat — which can have potentially devastating consequences.
The OWASP Benchmark doesn’t differentiate among vulnerabilities, weighing each one equally. However, in its Top 10 Project, OWASP highlights vulnerabilities that are more likely to result in serious breaches and are common in software applications.
We combined the Top 10 list with the Benchmark to better understand how Kiuwan performs at rooting out the most serious vulnerabilities.
The Benchmark has all the test cases classified by vulnerability type mapped to correspondent CWEs. Here is the classification and the mapping.
| Vulnerability type | CWEs |
| Cross-site Scripting – XSS | 79 |
| Command Injection | 78 |
| SQL Injection | 89 |
| LDAP Injection | 90 |
| XPath Injection | 643 |
| Path Traversal | 22 |
| Weak Hashing Algorithm | 328 |
| Trust Boundary | 501 |
| Weak Randomness | 330 |
| Weak Encryption Algorithm | 327 |
| Insecure Cookie | 614 |
We mapped these 11 vulnerability types and assigned weights based on severity to test Kiuwan’s performance on critical vulnerabilities better. We assigned a weight from 1 to 10 so more critical vulnerabilities would be ranked higher.
| Vulnerability type | CWEs | Top 10 | Weight |
| Cross-site Scripting – XSS | 79 | A3- Cross-site Scripting (XSS) | 8 |
| OS Command Injection | 78 | A1-Injection | 10 |
| SQL Injection | 89 | A1-Injection | 10 |
| LDAP Injection | 90 | A1-Injection | 10 |
| XPath Injection | 643 | A1-Injection | 10 |
| Path Traversal | 22 | A4- Insecure Direct Object Reference | 7 |
| Reversible One-Way Hash | 328 | A6- Sensitive Data Exposure | 5 |
| Trust Boundary Violation | 501 | A2-Broken Authentication and Session Management | 9 |
| Insufficiently Random Values | 330 | A9-Using Components with Known Vulnerabilities | 2 |
| Use of a Broken or Risky Cryptographic Algorithm | 327 | A6- Sensitive Data Exposure | 5 |
| Sensitive Cookie in HTTPS session without “Secure” attribute | 614 | A5-Security Misconfiguration | 6 |
We did this because our customers are naturally more concerned with addressing critical vulnerabilities than non-critical ones. Treating all vulnerabilities equally could allow a tool that excels in identifying low-priority vulnerabilities to outrank one that excels at handling high-priority vulnerabilities. In practice, this could expose you to the types of attacks resulting in devastating consequences.The following results are for the open-source tools detailed in the OWASP Benchmark GitHub repository, SonarQube, which we ran ourselves, and Kiuwan. The scorecard graphs the performance of these eight tools with a weighted benchmark.
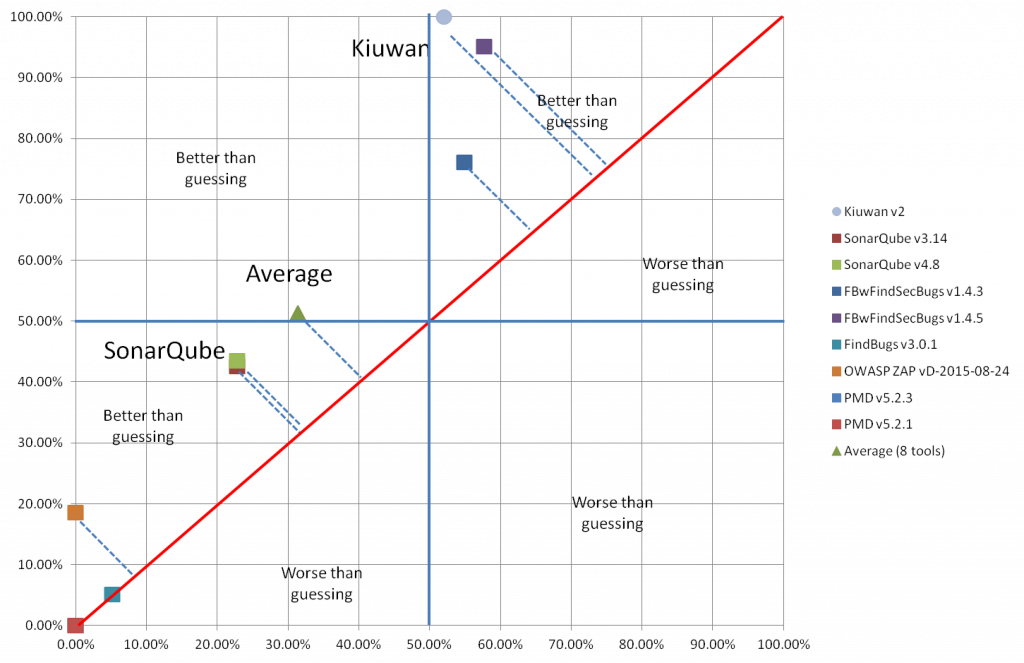
These weighted metrics align with high-priority, critical vulnerabilities like those in the 2021 OWASP Top 10. This measures tools by their ability to handle the threats that matter most in today’s security landscape.
The results were charted as follows:
If a tool handles half of the True Positives in the Benchmark correctly, with the average calculation, it will be approximately halfway up the Y-axis in the graph. However, with the weighted calculation, if those vulnerabilities are less critical than the 50% the tool missed, it will be placed below 50%. If it found 50% of the high-priority vulnerabilities but overlooked lower-priority ones, it would be above the 50% line.
As you can see, Kiuwan handled the critical vulnerabilities better, and the false positives were more closely correlated with critical vulnerabilities. In an ideal world, there would be no false positives, but it’s better to be alerted to the possibility of critical vulnerabilities than to overlook them.
Although the OWASP Benchmark was originally designed for Java, it’s still a reliable baseline for evaluating the capabilities of security tools. There aren’t any other similar, unbiased tools for analyzing how these mission-critical applications perform. Kiuwan’s results highlight its ability to maintain a high sensitivity to vulnerabilities so your applications will remain secure in the face of evolving threats.
From OWASP Top 10 coverage to real-world SAST performance, Kiuwan can help secure your code against cyber threats. Download a free trial to begin exploring its capabilities today.

